
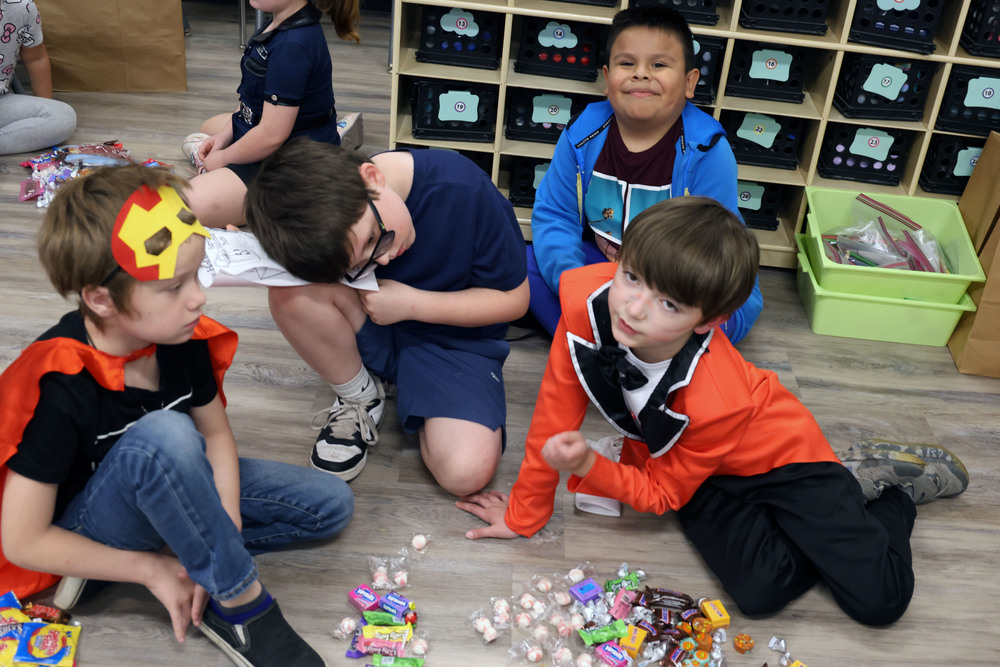
A group of Cleveland Elementary School third graders learned you can do more with Halloween candy than just eat it. You can sort it by size and color and favorite kinds or by sweet or hard or by its packaging.
The third graders crowded into a classroom where bags of sweet treats awaited them. After being divided into groups, each team was given a bag full of candy which would serve as the basis for their experiments. The candy was dumped into the middle of each team as they made a circle on the floor.
First they were asked to estimate the number of pieces of candy they were given. In a team consisting of Axel Hernandez, Jason Brownlee, Jonah Prentice and Kol Vrana, Hernandez came closest to guessing the number of candies in their pile. He guessed 99, and the actual number was 109.
After establishing how many pieces they had, the teams sorted the candy by color, then by chocolate/not chocolate, and then by size. Some debate ensued over what constituted “small” pieces and what constituted “medium” and “large” pieces.
“I think that’s small and that’s medium,” Prentice said as he pointed to various pieces of candy. After the boys decided on how to differentiate the sizes, they created their piles and counted how many pieces were in each pile. The process was repeated for chocolate/not chocolate.
The entire activity, which is based on the book “Harriet’s Halloween Candy,” was an effort to find a fun way to teach students graphing, said third grade teacher Kristy Campbell. The book tells the story of Harriet, who tries to hide her Halloween candy from her little brother. She organizes the candy by size, color and favorites and keeps moving the stash around her room.
Campbell turned the story into a graphing exercise for her third graders. After each sorting activity, the results are noted on a piece of paper.
“It shows students it’s (candy) not just for eating,” Campbell said. “This is a math activity. They will graph the candy on a chart. Graphing is one of our standards, and we wanted to make it fun for them. It expands how they look at graphing.”
The activity also calls for teamwork. Members of each team must work together to determine which pile the candy belongs in and who is going to do certain tasks, like trying to decide whether they should sort by hard/not hard candy or see-through/not see-through packaging.
Brownlee wanted to sort by hard/not hard while Prentice wanted to sort by see-through/not see-through packaging, explaining that was easier. After a split vote, the boys decided to settle the issue by a game of rock, paper, scissors, with hard/not hard winning.
The four-person team was so engrossed in their sorting activity, that they forgot to record their answers and had to repeat some of the tasks.
“Honestly, I’ve just been having too much fun to learn,” Brownlee said. “We get to do a fun activity with all our friends.”
“It’s kind of like Christmas only with friends and not family,” Prentice said.
The mound of sugary treats proved tempting, and plans were made on what to do with the candy after the exercise was over.
“Guys, when we start eating, should we start with the chocolate?” Brownlee asked.
Campbell said the activity is perfect for third graders.
“This is right in their wheelhouse,” she said. “When we get ready to study graphs, this will give them an idea of how to graph.”
Campbell said the activity served a dual purpose: It also was the students’ Halloween party.
“They get to pick some candy out of their bag to eat,” she said, while she kept some of the candy to dole out as rewards.